
The Deceptive Promise of the Average
“It’s the Law of Averages: Put in more to come out with more.” This Bruce Lee quote captures a seductive truth—that effort correlates with results. But the mathematical concept of averages also reveals something troubling about how societies use data to obscure inequality and justify systemic harm.
Understanding averages is important. But understanding how averages are misused—to hide poverty, justify policy, and obscure inequality—is essential.
The Mathematical Foundation: What Averages Actually Tell Us
An average is a measure of central tendency, an estimate of where the center point of a dataset lies.
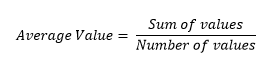
Definition: The average (arithmetic mean) of a group of numbers equals the sum of all values divided by the number of values.
This mathematical simplicity is precisely why averages are so dangerous. When we reduce complex realities to a single number—the average—we erase the variation, inequality, and injustice hidden within the dataset.
An Alternative Understanding of Averages
The average can also be understood as a replacement value. If you could replace each number in a set with the average, the total sum would remain unchanged. This reframing is important because it highlights a crucial property: an average represents a hypothetical uniform distribution of resources that masks the actual unequal distribution.
For example, if five people have incomes of $10,000, $20,000, $30,000, $40,000, and $50,000, the average income is $30,000. But stating “the average income is $30,000” obscures the reality: two people earn less than the average, two people earn more, and one person earns exactly the average. More troublingly, this “average” completely masks the growing gap between the poorest and richest.
The Balancing Method: Illusion of Equilibrium
The balancing method presents the average as an equilibrium point where surpluses above the average perfectly counterbalance deficits below the average.
For instance: The average of 3, 5, and 10 is 6.
- 3 is 3 less than 6
- 5 is 1 less than 6
- 10 is 4 more than 6
The total deficit (3 + 1 = 4) equals the surplus (4), creating perfect balance.
This visualization is mathematically elegant. But it contains a hidden ideology: it suggests that inequality is inherently balanced, that surpluses naturally offset deficits, that systems naturally tend toward equilibrium. This is profoundly misleading. In actual societies, deficits and surpluses do not naturally balance. The wealthy accumulate more, the poor fall further behind, and the “average” becomes increasingly meaningless as inequality widens.
Core Properties of Averages
Understanding these mathematical properties is necessary—but each also reveals how averages can deceive:
Property 1: Sum Calculation
If you know the average and the count, you can find the sum: Sum = Average × Count
The danger: Knowing the average of a large population tells you almost nothing about individual circumstances. Stating “the average net worth is $100,000” obscures whether wealth is broadly distributed or concentrated in a tiny elite.
Property 2: Evenly-Spaced Numbers
For evenly-spaced numbers, the average equals the middle value.
The issue: Most real-world distributions are not evenly spaced. Income distributions, wealth distributions, and health outcomes follow skewed patterns where a few extreme values dramatically skew the average upward.
Property 3: Bounds
The average always falls between the minimum and maximum values.
The implication: This seems obvious, but it highlights a critical problem: if you want to hide extremes, use the average. If the poorest 10% have no wealth and the richest 1% controls 40% of all wealth, the average wealth obscures both extremes.
Property 4: Zero-Sum Distance
The distance above the average equals the distance below the average.
The ideological danger: This mathematical property suggests moral equilibrium—that losses are balanced by gains. But societies are not mechanical systems. When wealth concentrates at the top, the distance below the average grows, while the distance above also grows, but the number of people in each distance changes dramatically. The mathematical balance masks human suffering.
Property 5: Substitution
If the average of n numbers is x, you can mentally replace all numbers with x without changing the sum.
Why this matters: This is how policy-makers justify inequality. “The average person has X resources, so scarcity isn’t a problem.” But the average person doesn’t actually exist. If averages masked inequality in your salary, would you accept it? Yet societies accept this substitution constantly in public policy.
Property 6: Bounded Changes
If you reduce the smallest number and increase the largest by the same amount, the average stays the same.
Example: The average of (9, 10, 11) equals the average of (7, 10, 13). Both equal 10.
The critical insight: This property reveals a dangerous feature of averages: you can dramatically increase inequality while keeping the average unchanged. A policy that takes $2 from the poor and gives $2 to the rich keeps the average constant while worsening inequality. This is exactly how many economic policies actually function.
Property 7: Temporal Averages
If the average age of a group is x today, it will be (x + n) after n years, since everyone ages uniformly.
The limitation: This property assumes uniform change, but societies don’t age uniformly. Birth rates vary by socioeconomic class, mortality rates differ by geography and income, and demographic changes concentrate at different ends of the socioeconomic spectrum.
Property 8: Average Speed
If you travel equal distances at speeds x and y kmph, your average speed is 2xy/(x+y) kmph.
Why this matters: Average speed is not the arithmetic mean of the speeds—it’s a weighted average based on time spent, not distance. This illustrates how averages require understanding what is actually being averaged. Most people misunderstand this, leading to incorrect conclusions about efficiency, productivity, and resource allocation.
Practical Example: The Danger of Simplification
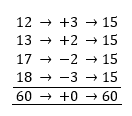
Question: What is the average of 12, 13, 17, and 18?
Solution: (12 + 13 + 17 + 18)/4 = 60/4 = 15
This means if all four numbers were replaced by 15, the sum would remain 60. But note the actual distribution: two numbers (12, 13) are below the average, two numbers (17, 18) are above. The spread is relatively small.
But what if the numbers were 1, 2, 28, and 29? The average would still be 15—but now the distribution is bimodal, with a huge gap in the middle. The average has become nearly meaningless.
This is precisely how societies use averages to obscure inequality. A country can have an “average income” that appears respectable while harboring extreme poverty and extreme wealth.
The Concept of Weighted Average: Making Inequality Explicit
Weighted averages acknowledge that not all data points have equal importance. Some have more “weight”—they matter more to the outcome.
Formula: Weighted Average = (Sum of all values × their weights) / (Sum of all weights)
This is where averages become honest about inequality—if we use them correctly.
For example:
- If 1% of the population controls 40% of wealth, a weighted average would correctly reflect that this 1% should have much higher weight in calculating “representative” wealth
- If one person’s vote in politics carries more weight through money and connections, a weighted average should acknowledge this political inequality
- If some workers are more productive than others, a weighted average of productivity appropriately reflects their differential contribution
But here’s the critical problem: Societies routinely use unweighted averages to obscure weighted realities. We state “the average American has X wealth” (unweighted) while ignoring that wealth is massively weighted toward the top. We state “the average employee is productive” while ignoring that some employees are vastly more leveraged and influential than others.
Why Averages Exist: The Desire to Simplify
Averages exist for a reason: human minds struggle with large datasets. We need summary statistics. But this practical need has become an ideological tool.
By condensing inequality into a single number—the average—we:
- Hide extremes and suffering
- Create illusions of balance and equilibrium
- Justify ignoring outliers and edge cases
- Suggest that widespread benefit follows from policies that benefit the average (while harming those below it)
The Educational Failure: Teaching Averages Without Critical Thinking
Educational systems teach students to calculate averages as if they are neutral, objective measures. They teach the mathematical properties without teaching the limitations. They prepare students to misuse or be misled by averages.
A genuinely educational approach would:
- Teach the mathematics thoroughly — understand properties, formulas, and calculations
- Teach critical interpretation — what does an average reveal? What does it hide?
- Provide context on misuse — how are averages weaponized in policy, marketing, and politics?
- Introduce complementary statistics — standard deviation, median, mode, percentiles, distribution shapes
- Build skepticism — automatically ask “who benefits from presenting this as an average?” and “what is being hidden?”
Conclusion: The Average Is Not Neutral
Averages are mathematical tools. But like all tools, they carry the fingerprints of those who wield them. When a society uses the average income to justify why poverty assistance isn’t needed, the average has become a weapon. When an average hides the extreme inequality that drives injustice, the average is complicit.
Understanding averages means understanding both the mathematics and the ideology. It means recognizing that simplification always erases some truth. And it means asking, every time someone cites an average: What variation is being hidden? Who benefits from this particular simplification? What would the full distribution reveal?
The Law of Averages suggests that effort produces results. But it takes critical thinking to recognize that averages can obscure whether that effort is being fairly distributed and fairly rewarded.